WVTool
Open Window Visualization Tool
Description
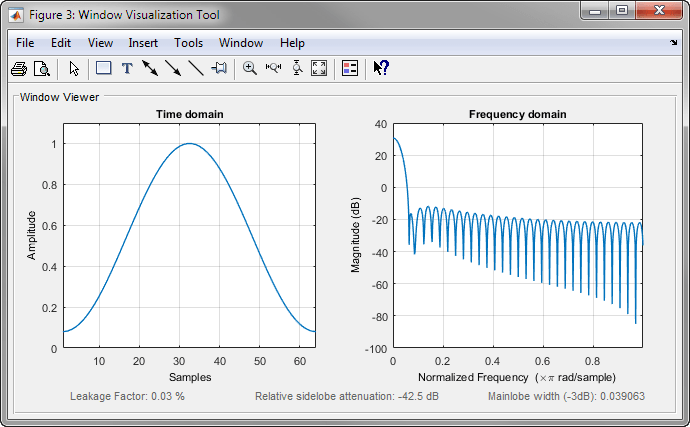
Window Visualization Tool is an interactive tool that enables you to
visualize time and frequency domain plots of the window vector. You can generate window
vectors for a number of common window functions using the Signal Processing Toolbox™ software. See window for a list of supported window
functions.
Note
A related tool, Window Designer, is available for designing and analyzing windows.
Open the WVTool
WVTool can be opened programmatically using one of the methods described in Programmatic Use.
Examples
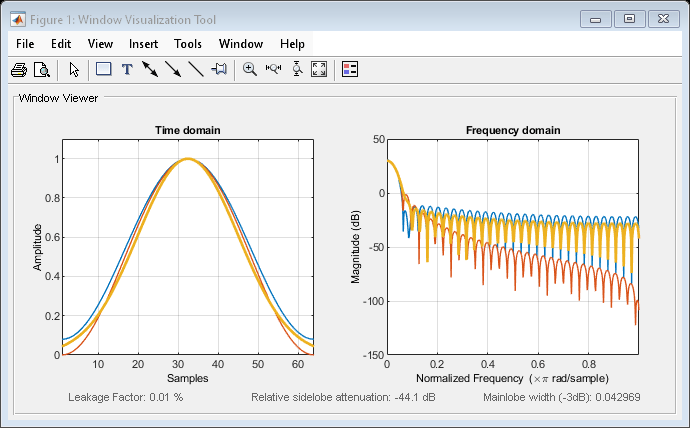
Display and Compare Windows
Use wvtool to display and compare 64-point Hamming, Hann, and Gaussian windows.
wvtool(hamming(64),hann(64),gausswin(64))
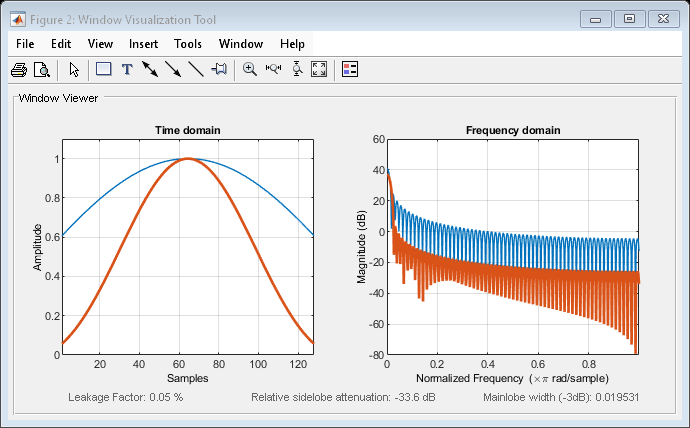
Compare 128-point Kaiser windows with different values of .
wvtool(kaiser(128,1.5),kaiser(128,4.5))
Programmatic Use
More About
Version History
Introduced before R2006a
You can also select a web site from the following list:
Americas
- América Latina (Español)
- Canada (English)
- United States (English)
Europe
- Belgium (English)
- Denmark (English)
- Deutschland (Deutsch)
- España (Español)
- Finland (English)
- France (Français)
- Ireland (English)
- Italia (Italiano)
- Luxembourg (English)
- Netherlands (English)
- Norway (English)
- Österreich (Deutsch)
- Portugal (English)
- Sweden (English)
- Switzerland
- United Kingdom (English)