box
Display axes outline
Description
box on displays the box outline around the current axes
by setting its Box property to "on". This
property value is the default for GeographicAxes
objects.
box off hides the box outline around the current axes by
setting its Box property to "off". This
property value is the default for Axes and
PolarAxes objects.
box toggles the display of the box outline.
box( displays or hides
the box outline by specifying a visibility)visibility value. You can
specify visibility as "on",
"off", a logical value, or an
OnOffSwitchState value.
Examples
Display Box Outline Around Axes
Plot a surface and display the box outline around the axes.
[X,Y,Z] = peaks;
surf(X,Y,Z)
box on
Turn off the display of the box outline.
box off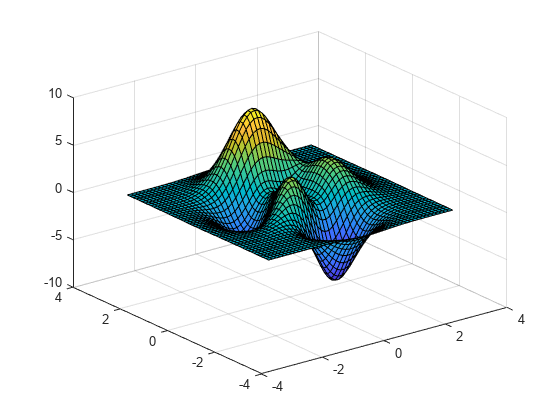
Change Style of Box Outline
First, plot a surface and display the box outline around the axes. By default, the outline appears around the back planes of the axes because the BoxStyle property of the axes is set to 'back'.
[X,Y,Z] = peaks;
surf(X,Y,Z)
box on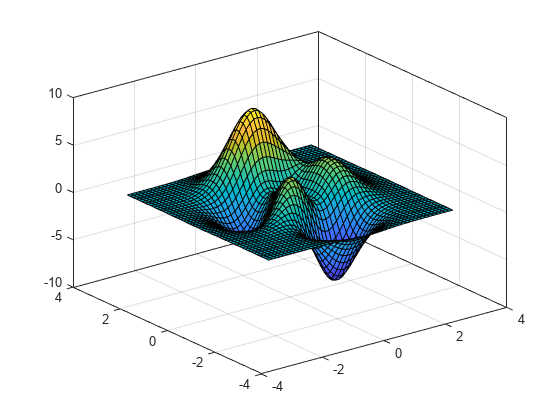
Next, display the outline around the entire axes by setting the BoxStyle property to 'full'. Use dot notation to set properties.
ax = gca;
ax.BoxStyle = 'full';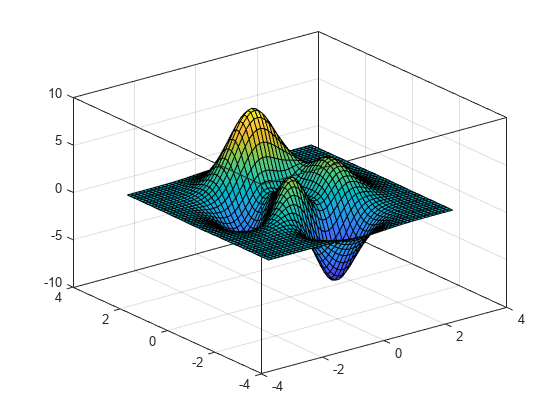
Change Color of Box Outline
Create a scatter plot and display the box outline around the axes.
x = rand(10,1);
y = rand(10,1);
scatter(x,y)
box on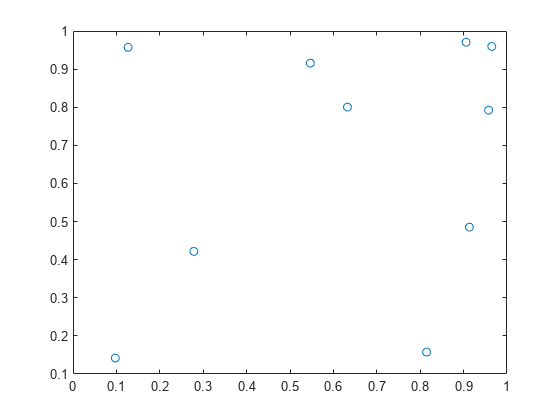
Change the color of the box outline in the x-axis direction by setting the XColor property of the axes. Use dot notation to set properties.
ax = gca;
ax.XColor = 'red';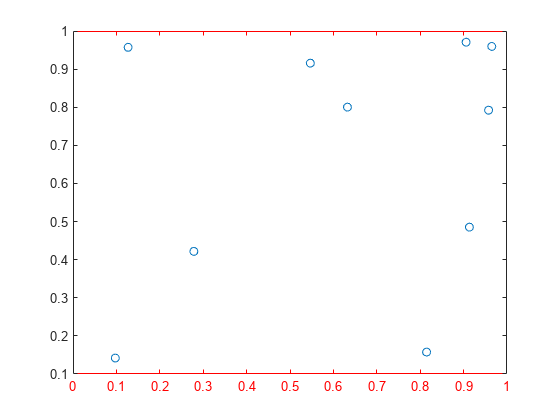
Turn Off Box Outline for Specific Axes
Create two axes using the tiledlayout and nexttile functions. Assign the axes objects to the variables ax1 and ax2, and plot into the axes. Remove the box outline around the lower plot by specifying ax2 as the first input argument to box.
tiledlayout(2,1)
ax1 = nexttile;
plot(ax1,1:10)

ax2 = nexttile;
plot(ax2,1:10)
box(ax2,'off')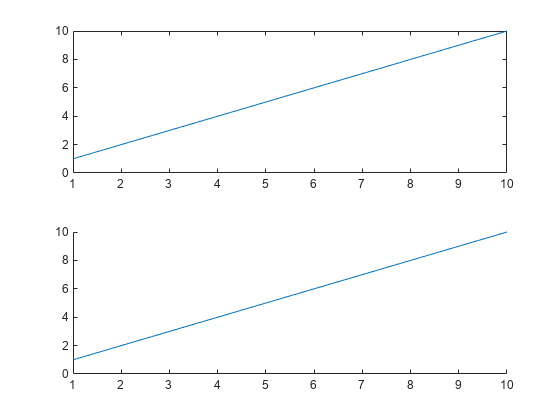
Input Arguments
Tips
Some Cartesian axes properties affect the appearance of the box outline. This table lists a subset of axes properties related to the box outline.
Axes Property Description BoxDisplay of box outline BoxStyleStyle of box outline XColor,YColor,ZColorBox outline color in the x-axis, y-axis, and z-axis directions LineWidthWidth of box outline, tick marks, and grid lines Some polar axes properties affect the appearance of the outline around the polar axes. If you are working with polar axes, then the
boxcommand controls the outline display when the theta-axis limits do not span 360 degrees. This table lists a subset of polar axes properties related to the outline.PolarAxes Property Description BoxDisplay of full outline RColor,ThetaColorOutline color LineWidthWidth of outline, tick marks, and grid lines Some geographic axes properties affect the appearance of the box outline. This table lists a subset of geographic axes properties related to the box outline.
GeographicAxes Property Description BoxDisplay of box outline AxisColorColor of outline, tick values, and labels LineWidthWidth of box outline, tick marks, and grid lines
Algorithms
The box function sets the Box property of the Axes, PolarAxes, or GeographicAxes object to either "on" or
"off".
Version History
Introduced before R2006aSee Also
Functions
Properties
You can also select a web site from the following list:
Americas
- América Latina (Español)
- Canada (English)
- United States (English)
Europe
- Belgium (English)
- Denmark (English)
- Deutschland (Deutsch)
- España (Español)
- Finland (English)
- France (Français)
- Ireland (English)
- Italia (Italiano)
- Luxembourg (English)
- Netherlands (English)
- Norway (English)
- Österreich (Deutsch)
- Portugal (English)
- Sweden (English)
- Switzerland
- United Kingdom (English)